Dashboard & alerts
This guide shows you how to read the dashboard indicators — treasury, activity, points of attention — and handle the guided alerts to steer your business day to day. The dashboard doesn’t just display figures — it guides you to the next action.
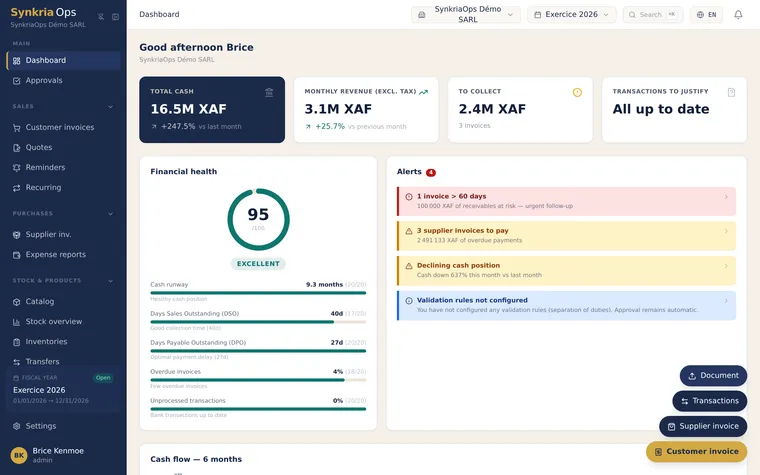
Reading the key indicators (KPIs)
Section titled “Reading the key indicators (KPIs)”| Indicator | What it shows |
|---|---|
| Treasury | The consolidated balance of your accounts, computed from the general ledger |
| Revenue | The month’s revenue, with change versus the previous month |
| Overdue | The amount of overdue customer invoices |
| To justify | Bank transactions awaiting assignment |
Anticipating with treasury forecasts
Section titled “Anticipating with treasury forecasts”The dashboard projects your treasury over 6 and 12 months, from your known deadlines (invoices to collect, to pay, payment schedules). This lets you anticipate cash-flow pressure before it hits.
Tracking the financial health score
Section titled “Tracking the financial health score”A health score summarises the state of your business and pairs it with localised advice: it doesn’t stop at a grade, it explains what makes it go up or down.
Handling guided alerts
Section titled “Handling guided alerts”This is the heart of the approach: rather than leaving you to search, the dashboard shows clickable alerts that point to the action to take.
Examples of common alerts:
- bank transactions are waiting to be assigned;
- customer invoices are overdue;
- a fiscal year is nearing its close;
- OCR data needs reviewing.
Using the dashboard day to day
Section titled “Using the dashboard day to day”-
Open the dashboard at the start of the day.
-
Handle the alerts from top to bottom: they are your priorities for the day.
-
Check the treasury forecast before any major commitment.
See also
Section titled “See also”- General ledger — the detail behind the balances
- Trial balance — the overall accounting snapshot
- Cash flow forecast — the detailed forecasts